
Why grades are misleading
But grade probabilities are better!

Grades are an established feature of most assessment systems, and are taken for granted as a sensible way of reporting attainment data.
But do they deserve that status? They create a lot of distortions, they don’t mean what people think they do, and there are better alternatives available.
In this post, we’ll explain what the problems with grades are, how we do things differently, and what our new “grade probabilities” report looks like.
What people think student attainment looks like
Many people have a mental model of a grade as a discrete category that is separate and distinct from other grades. They think students in one grade are qualitatively different from students in another grade, as shown in the following image.
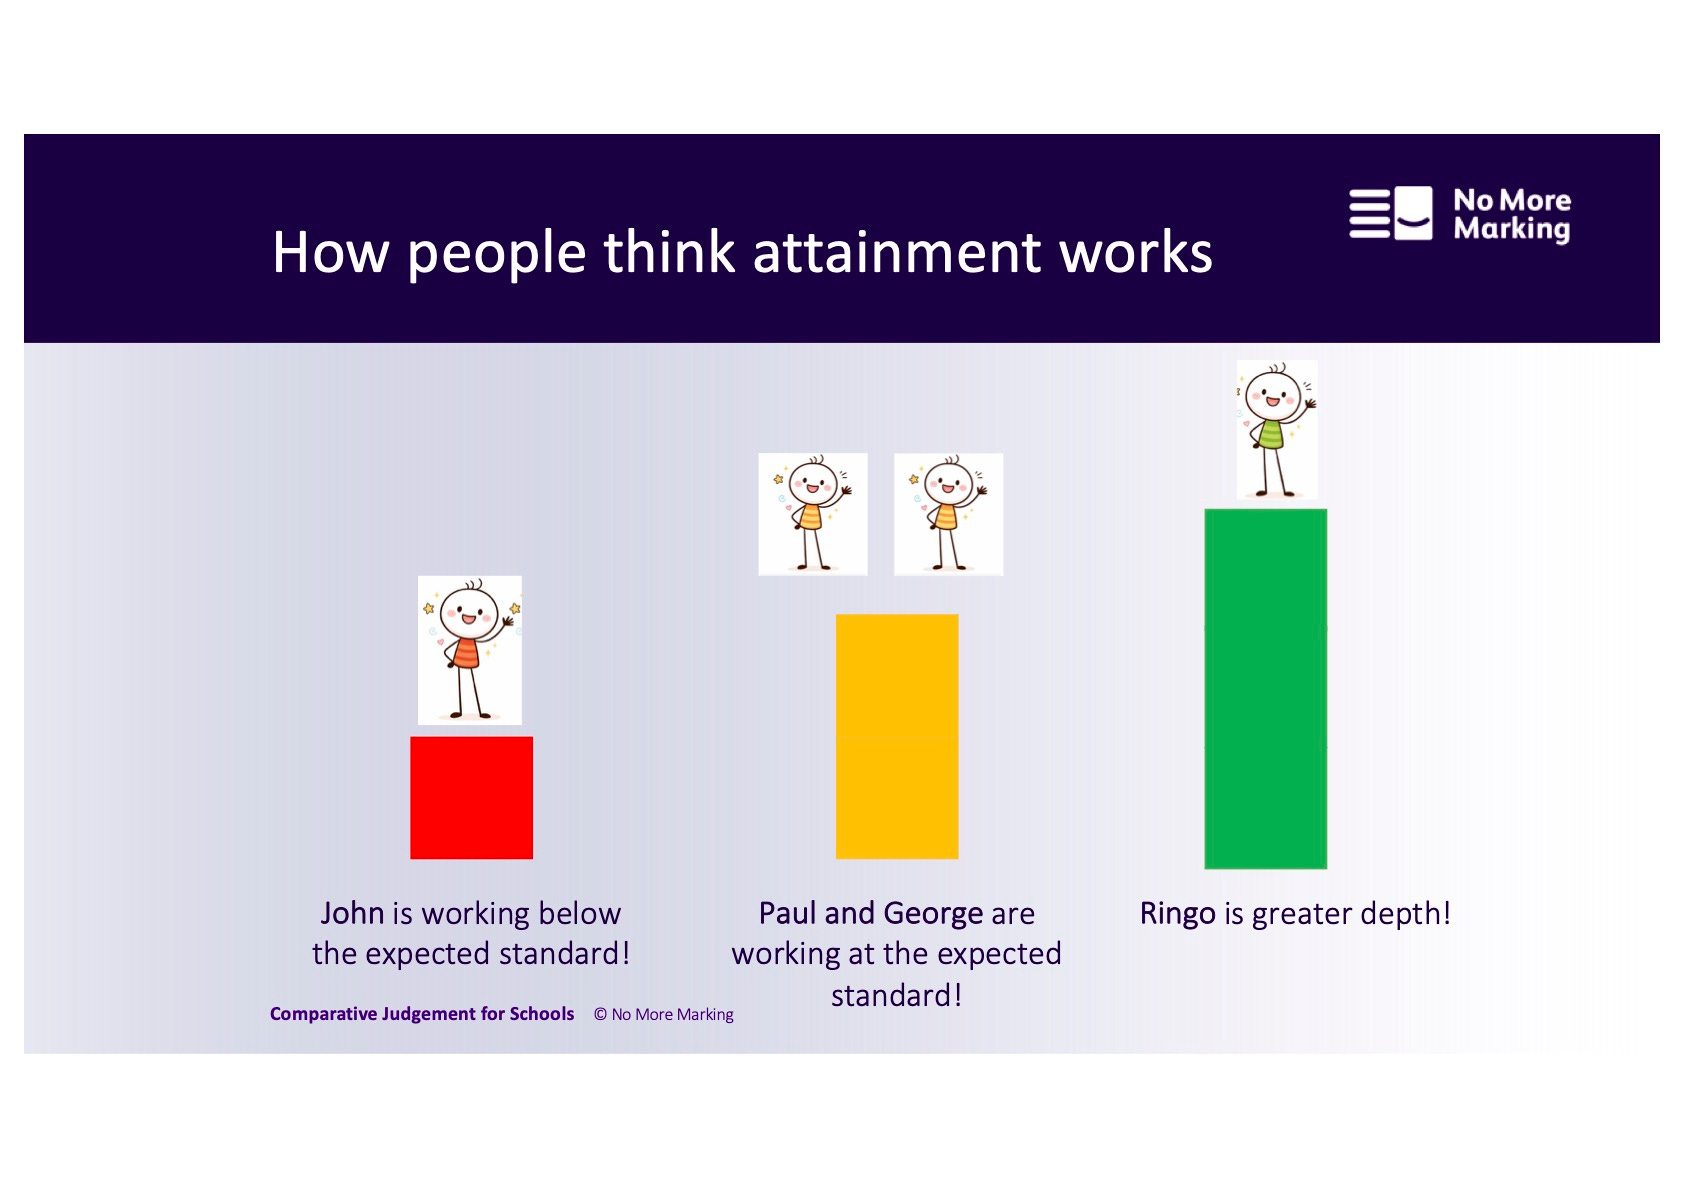
A number of aspects of our current grading system reinforce this idea. For example, we give grades labels like “at the expected standard”, and we have marking rubrics that suggest there are discrete breaks in performance between one grade and the next. In the chart above I have used the grades from England’s primary system, but almost every jurisdiction we work in has something similar. A lot of teacher-created grading systems have the same problem. “Red, amber, green” is a grading system. So is “emerging, expected, exceeding”.
However, this is not how attainment works, and thinking it does causes a lot of problems.
What student attainment actually looks like
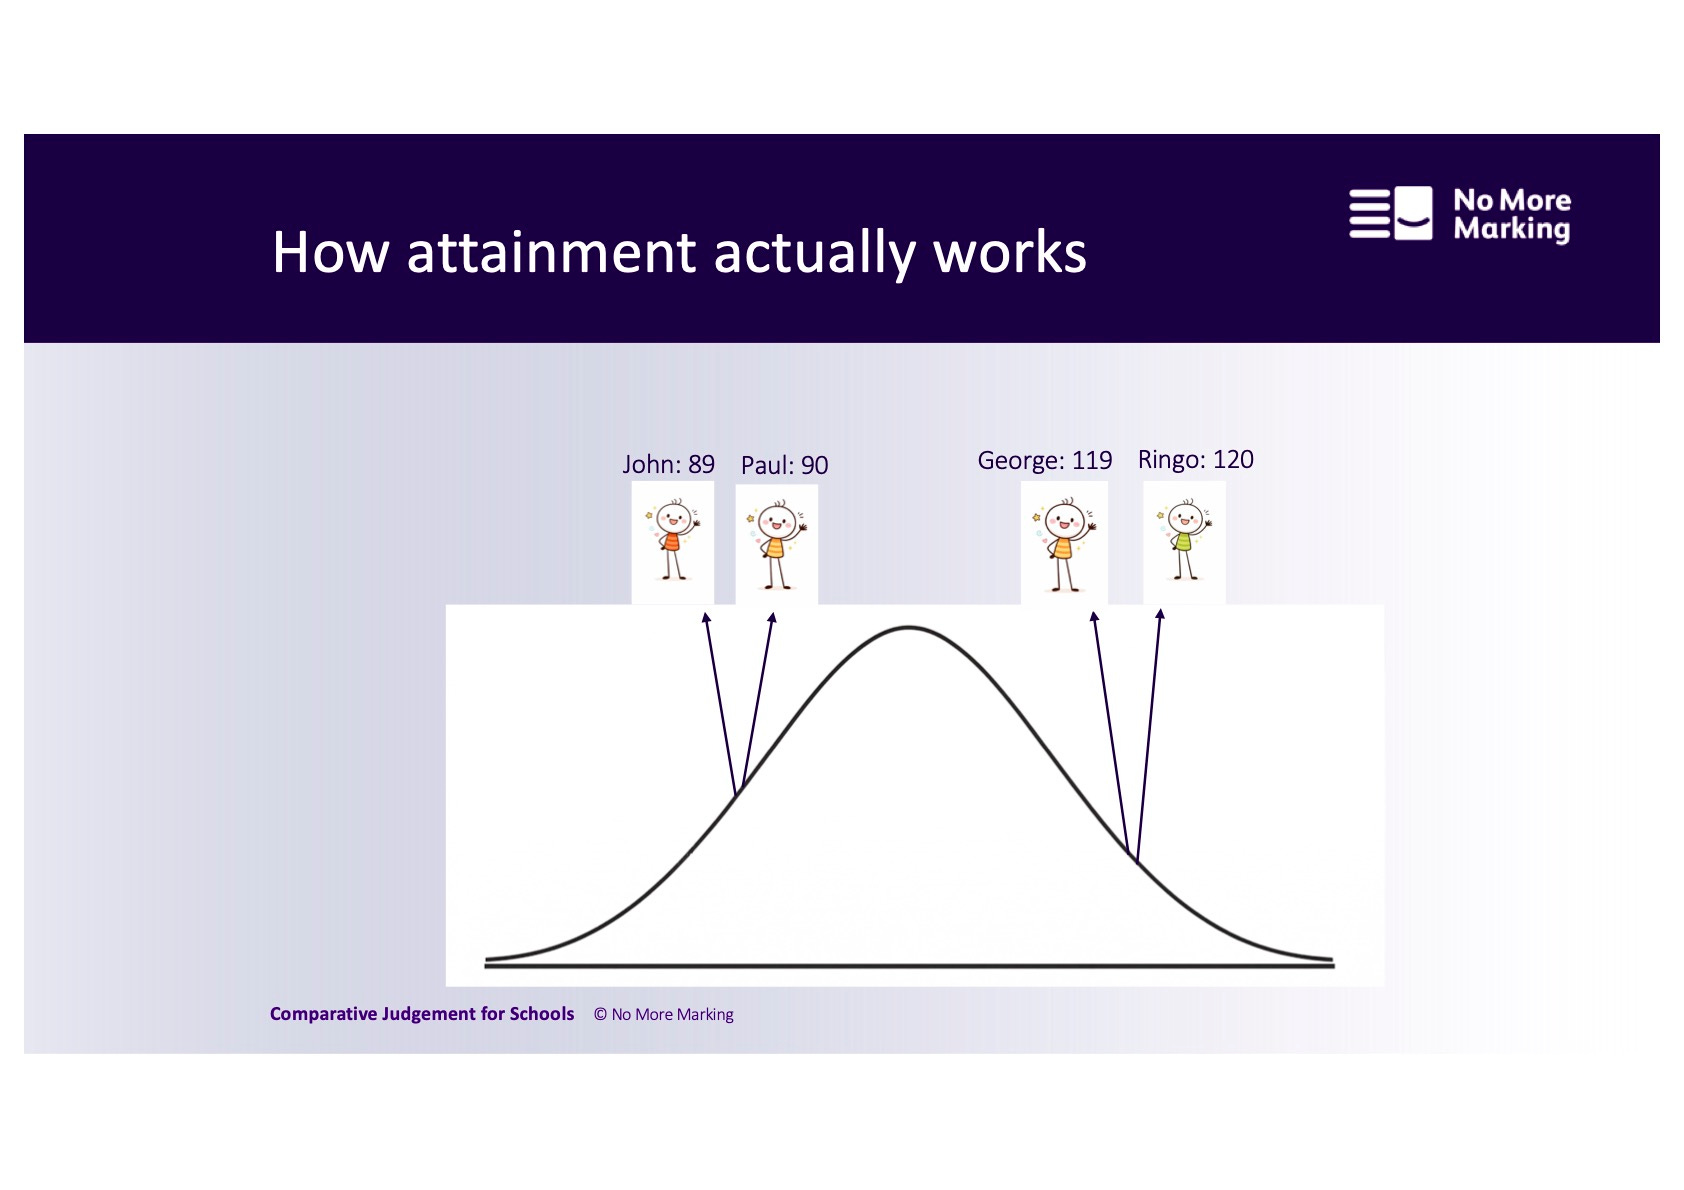
Student attainment follows a continuous distribution. The image below gives a much better representation of how it works.
Why this is a problem
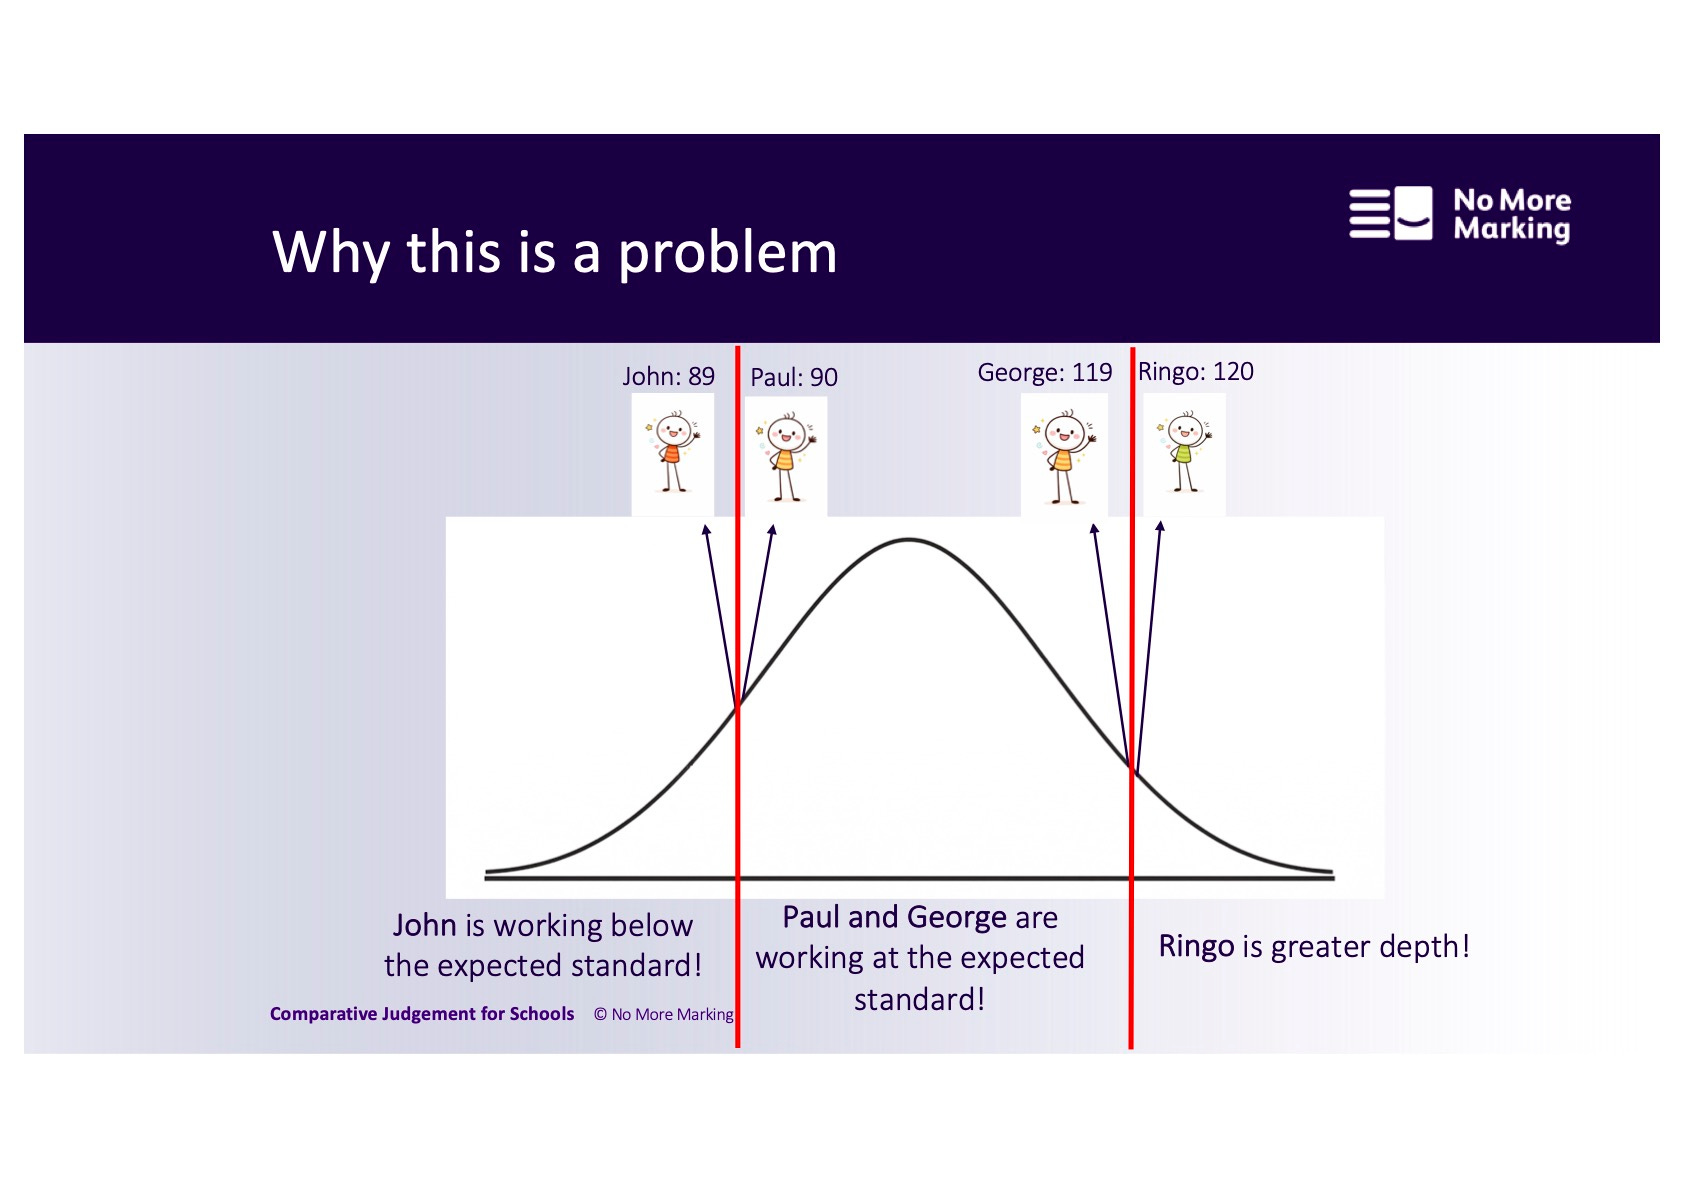
Grades are just lines drawn on an underlying distribution. They don’t correspond to sudden leaps in student attainment. When you treat them like they are discrete categories, it causes big distortions, as you can see in the image below.
Paul and George both have the same grade. But Paul has more in common with John, in the grade below. And George has more in common with Ringo, in the grade above.
A three-part grading system is the worst kind of grading system and causes all kinds of problems. The categories are too big to be useful. They incentivise tiny progress at the grade boundaries, and don’t reward big progress elsewhere. They result in very volatile accountability measures. And perhaps most damagingly, they are particularly bad for students at the bottom of the middle category – that is, in the chart above, Paul. Paul is told everything is OK and he is doing fine but in reality he is struggling as much as John is.
As well as these very practical and immediate problems, there is a deeper conceptual problem with thinking that student attainment is discrete. Three-part grading systems encourage the flawed idea that skills are discrete and that you can “level up” by teaching a new skill and jumping to the next grade. If, on the other hand, you accept that skills are composed of sub-skills and knowledge, you will recognise that students improve on a slow and steady incline, not in sudden jagged steps. I’ve written more about this link between assessment and the knowledge-skills debate here.
Improving reporting with scaled scores and writing ages
The ideal improvement would be to report scaled scores, not grades, and that’s what we do with all of our writing assessments. A criticism of this approach is that people don’t know what a scaled score means. One way we have tried to fix this in the past is by converting all our scaled scores to a writing age. We are quite proud of this and think that it is the first writing age anywhere in the world (although it follows very similar principles to reading ages, which are very popular). The basic principle is that we are trying to address the misconception about grades being discrete by using a comparison with an everyday metric – age – which everybody intuitively understands is continuous.
However, we still operate within a national system that uses a three part grading system, and the clash between the two systems causes problems. We report the writing age alongside the scaled score and the national Working Towards, Expected Standard, Greater Depth indicator. This means that it is possible for a student to get the Expected Standard label and still get a writing age that is lower than their chronological age. For example, a Year 6 student who is aged 11 could get a writing age of 9 years and 6 months, and still get the Expected Standard. We get so many questions from schools asking us how this is possible, and of course it is very confusing.
But it is the result of the government setting the Expected Standard at the 28th percentile. Expected Standard does not mean, as many people assume, that you are working at the average standard for your age. It includes students who are about 18-24 months below the average. This is true for reading and maths too. Our writing age hasn’t created this problem; it has just revealed it.
Our latest innovation: grade probabilities
In our upcoming set of Year 6 writing results, we’re going to introduce a new report: grade probabilities. This will tell you the percentage chance that a student is at a certain grade.
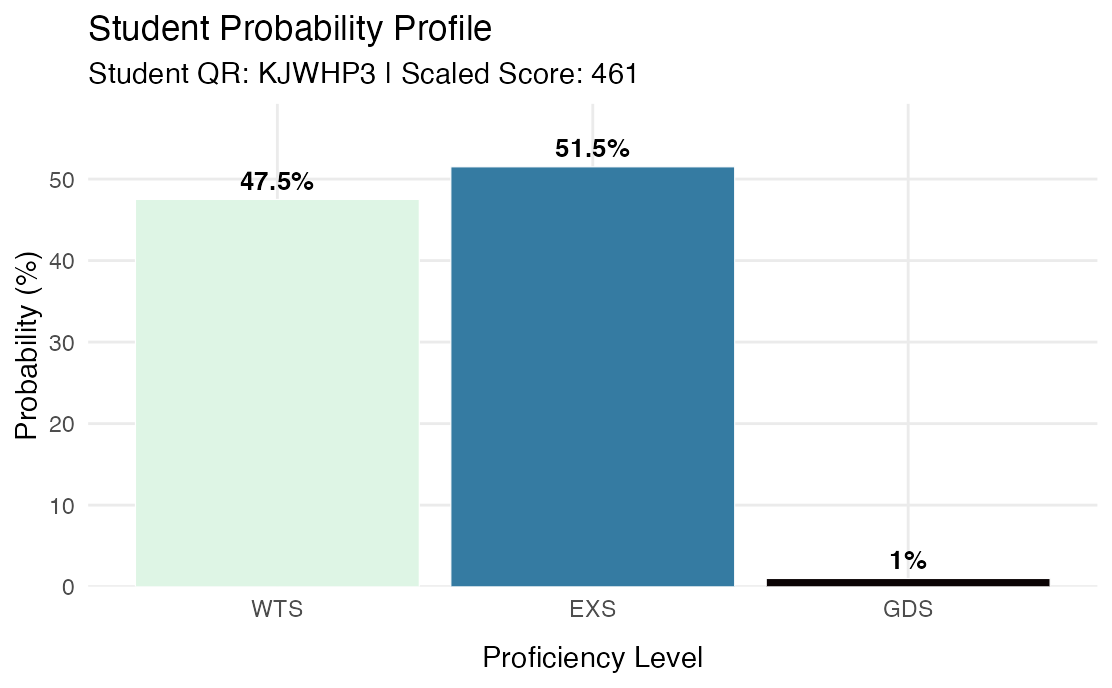
Here’s an anonymised example of a student with a similar profile to Paul. He has a 47.5% chance of getting the lower grade, and a 51.5% chance of getting the middle grade.
The metric here is measuring something different from the writing age. The writing age is a measure of attainment. It takes a given scaled score and just converts it into a typical age.
The grade probability is a measurement of certainty: how sure can we be that this student is above a certain threshold?
However, what both metrics have in common is that they replace a crude and distorting threshold system with a smooth and continuous metric.
We hope this will help schools when it comes to making decisions about Year 6 writing moderation. If it works well and schools like it, we can introduce it for more year groups and jurisdictions. If you’d like to learn more about our assessments, we have an intro webinar coming up later this month.
Very true - but my current feeling is that we also have to be careful of the sense of precision that fine-grained marks can give. I actually really like using descriptors without grades because the absence of ranking forces attention to the qualities of the writing, rather than the score.
This is excellent. A continuous curve of improvement that removes 'thresholding' effects would make for a much better system. I actually totally disagree with other comments we need less assessment. We just need better assessment that better informs teaching and wastes less time and creates less ambiguity. I would love to find a system that creates greater domain maps of competency. Even maths/English/reading is far too broad a spectrum from which to draw meaningful data and effective precise teaching.